

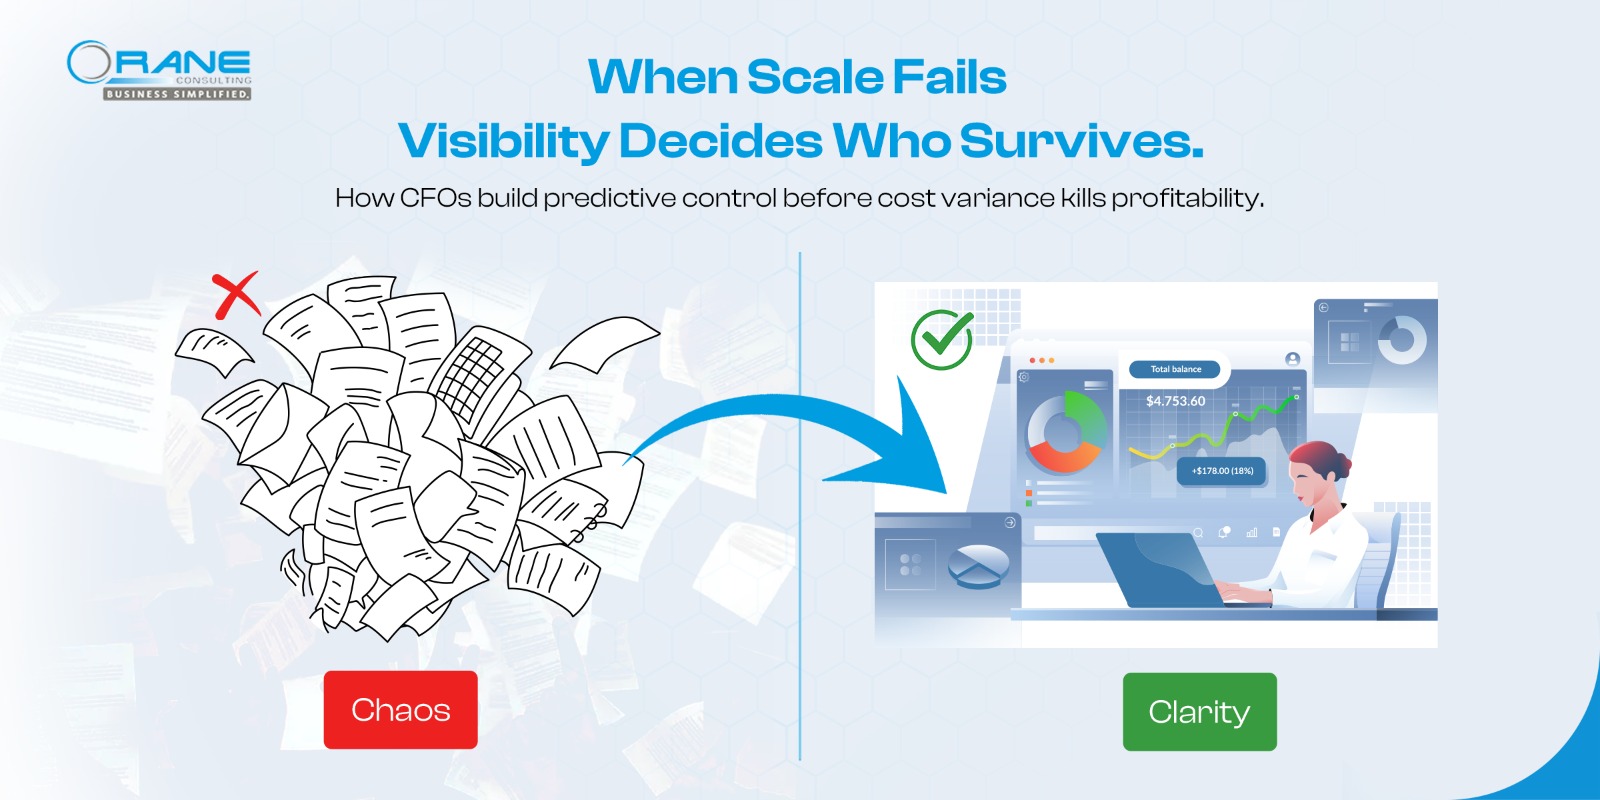
The Scaling Chaos: The CFO Paradox
Growth should empower control, not erode it — yet for most mid-market FMCG and QSR enterprises, revenue visibility improves while cost visibility collapses.
As firms cross ₹250–500 Cr, CFOs juggle exploding SKU portfolios, supplier claims, and logistics costs that scale faster than finance systems evolve.
Manual reconciliations and delayed postings create operational opacity — the invisible drain on profit.
According to the Retailers Association of India (RAI) Retail Business Survey (June 2025), India’s retail industry grew 8 % YoY, driven by consumer demand rebound and category diversification — yet CFOs report profitability lagging behind top-line growth due to margin dilution and rising operating costs.
🔗 RAI Retail Business Survey, June 2025
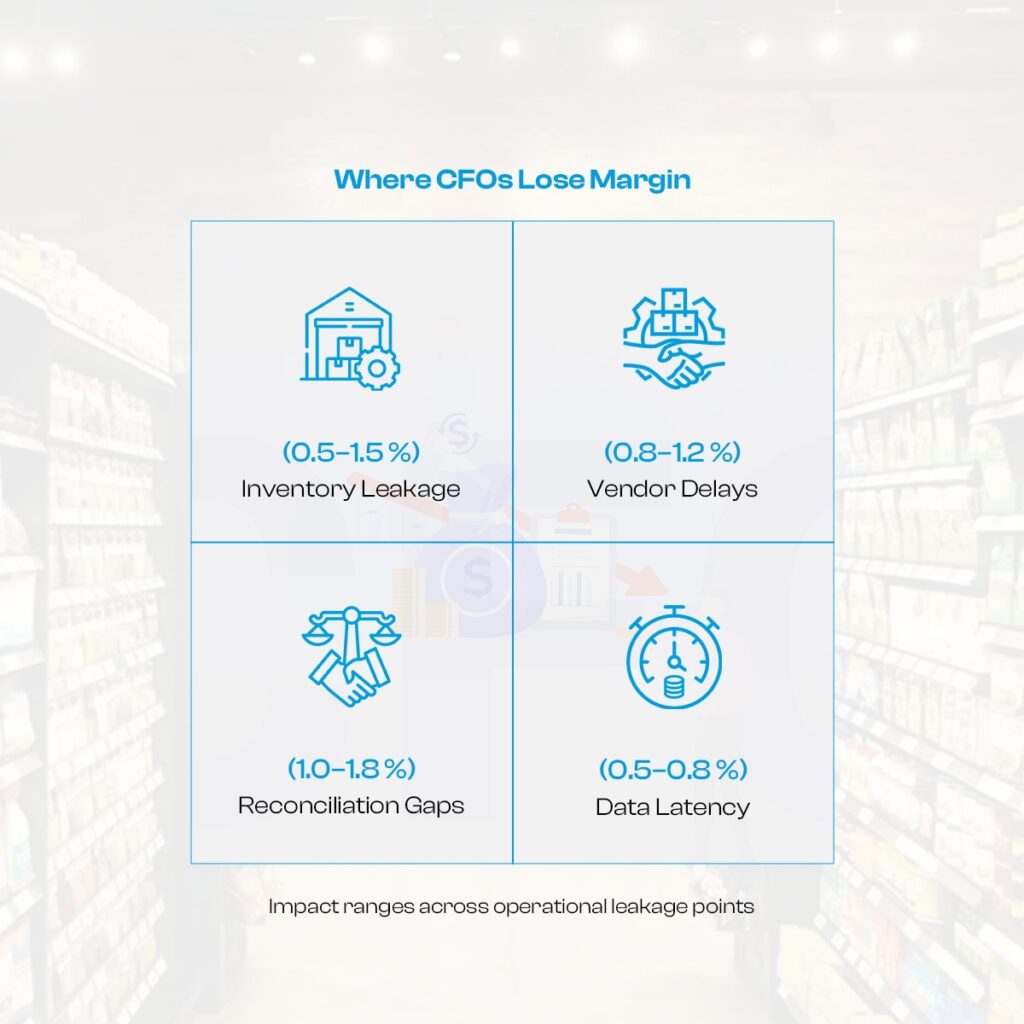
Enterprises typically lose 150–200 bps of EBITDA when cost visibility isn’t synchronized across procurement, logistics, and store operations.
Expectation → Revelation:
CFOs realise that scale doesn’t fail because they grow too fast — it fails because finance visibility lags behind business velocity.
The KPI Breakdown — What Really Hurts CFOs
Every CFO carries dual accountability: protect profitability and sustain growth. Yet four systemic choke points derail both:
- Working Capital Efficiency — Inventory turns widen as SKU proliferation outpaces demand predictability.
- Margin Leakage — Ingredient-level variances silently erode profit before consolidation.
- Reconciliation Delays — Vendor mismatches stretch closing cycles by 7–10 days.
- Cost Predictability — Finance lacks real-time linkage between operational drivers and P&L impact.
The EY State of Consumer Products 2025 report confirms that consumer-goods CFOs globally are “re-architecting finance systems to handle real-time data volatility,” with over 60 % planning predictive cost-control initiatives within the year.
🔗 EY State of Consumer Products 2025
Personal Lens: These gaps don’t just affect enterprise metrics — they hit your personal KPI grid:
- ROCE margin drift → board pressure.
- Working-capital lockups → missed reinvestment cycles.
- Delayed closes → reduced credibility in forecasts.
Result: CFOs spend 80 % of their time firefighting variance instead of engineering predictability
Manuj Gupta’s 80/20 Growth Blueprint captures a truth every CFO recognises:
“Twenty percent of levers drive eighty percent of results — yet most finance leaders spend eighty percent of time managing noise.”
Applied to finance:
- Top 20 % SKUs → 80 % margin — demand precision, not proliferation.
- Top 20 % vendors → 80 % reconciliation load — require automation, not escalation.
- Top 20 % dashboards → 80 % visibility — need integration, not addition.
Predictive profitability begins when CFOs channel attention to these leverage points — turning data noise into decision clarity.
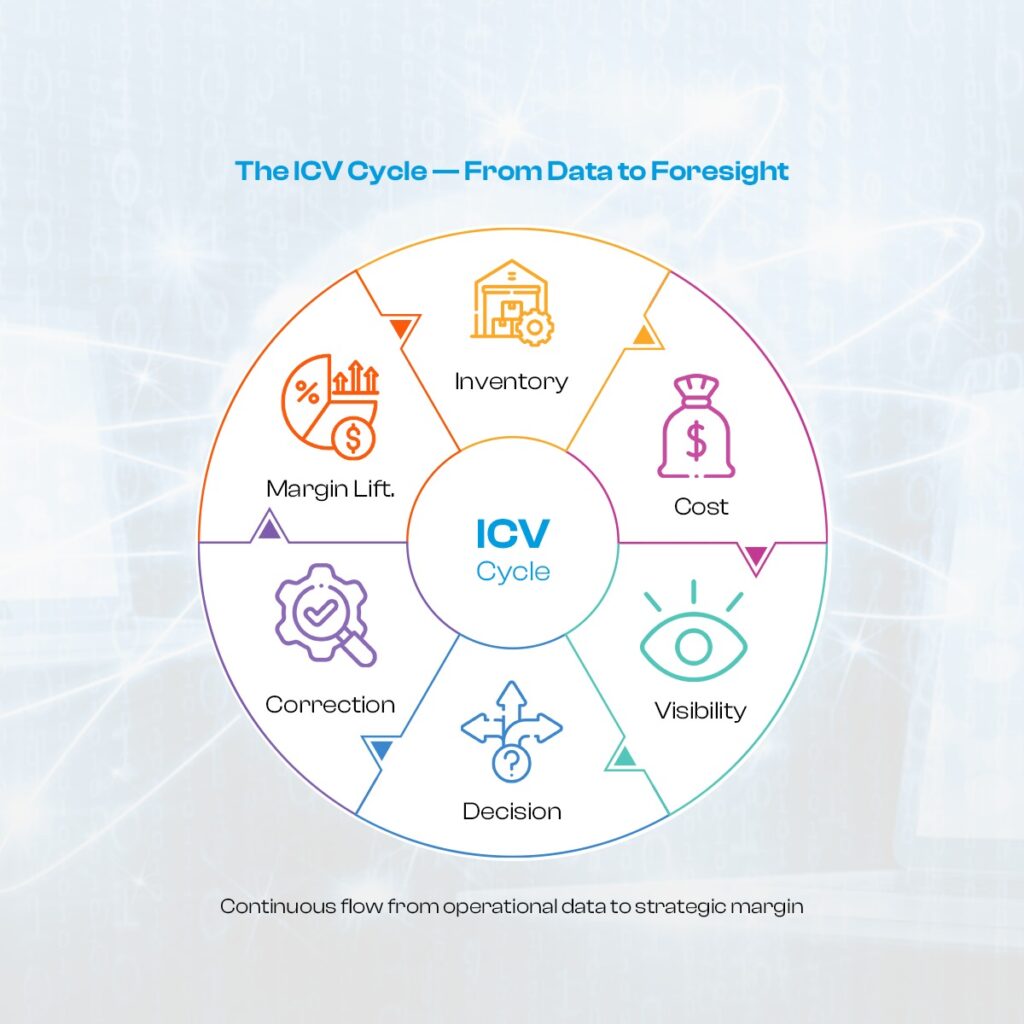
Introducing the ICV Framework
Inventory • Cost • Visibility — Predictive Finance Architecture
Orane Consulting’s ICV Framework brings together operational data and financial analytics to give CFOs a single version of truth.
🔹 Inventory Intelligence
Real-time SKU and batch tracking via SAP S/4HANA + SAP Analytics Cloud optimises stock turns, expiry management, and valuation alignment.
🔹 Cost Control
Predictive variance models across ingredients, logistics, and leases (using SAP RE-FX) flag anomalies before they appear on the P&L.
🔹 Visibility Layer
Interactive dashboards unify operations, supply, and finance KPIs — transforming finance from reactive reporting to predictive command.
Transition Cue:
This is where control becomes foresight — when a CFO can see margin risk before month-end.
Vendor Portal Synergy — Automating Financial Control
The ICV engine gains muscle when paired with Orane’s Vendor Portal Accelerator built on SAP Fiori.
It replaces fragmented email trails with a compliant, self-service environment that accelerates closing cycles.
Capabilities
- Auto-flag duplicate invoices & pricing anomalies.
- Consolidate supplier records across entities.
- Vendor self-service for document uploads & payment status.
Impact by CXO Role
| Role | KPI Impact | Source Type |
| CFO | Month-end cycle ↓ 45 %; reconciliation errors ↓ 25 % | Orane Client Benchmark Data (2025) |
| COO | Vendor response time ↓ 60 %; compliance ↑ 90 % | Retail Ops Benchmark 2025 / Internal Validation |
| CEO | Working capital released for growth investment | Manuj Campaign Base Content (2025) |
Within 12 weeks, clients reported 2–3 % margin uplift and 30 % admin reduction, validating automation as an ROI multiplier — not a cost centre. (Proprietary Orane Data — verified client implementations, 2025.)
Real-World Proof
“We didn’t just automate finance — we automated margin recovery.”
— CFO, Leading QSR Chain (India)
Case Highlights:
| Metric | Before | After | Impact |
| Month-end Close | 9 days | 5 days | –44 % faster |
| Vendor Reconciliation | Manual | Automated | +60 % efficiency |
| Operating Margin | — | +2.3 % | Margin Recovery |
| Admin Overhead | High | Lean | –30 % |
(Proprietary Orane Project Results — 2025 QSR Implementation Data.)
Reader Transition:
Imagine your next board review starting with a variance forecast — not a variance excuse.
The CFO Takeaway — From Data to Foresight
Predictive cost visibility is not a technology upgrade — it’s a boardroom imperative.
CFOs embedding ICV dashboards into quarterly reviews report:
- 40 % faster financial closures
- 25 % fewer reconciliation delays
- +200 bps margin recovery through early variance alerts
This mirrors broader market sentiment: the EY Future Consumer Index (March 2025) found that 68 % of global CFOs in consumer & retail sectors consider predictive finance the top investment priority for 2025 to protect margin amid price volatility.
🔗 EY Future Consumer Index 2025
Finance is evolving from scorekeeping to steering — from mirror to compass.
And those who anticipate variance today become the growth architects of tomorrow.
The Next Step for CXO Leaders
Scaling profitably isn’t about adding more — it’s about seeing more.
For CFOs and CXO leaders ready to benchmark financial visibility and margin-control maturity, Orane Consulting offers a CXO-Level Digital Diagnostic Session — a 90-minute boardroom-style strategy review that:
- Benchmarks your ICV Maturity Score
- Identifies the 20 % levers driving 80 % margin variance
- Provides a custom 90-day action roadmap toward predictive profitability